Research Article | | Peer-Reviewed

Carbon Emissions from Selective Logging: Case of FMU 1525 (Southern Cameroon)

Received: 3 February 2026     Accepted: 14 February 2026     Published: 4 March 2026
Views:       Downloads:
Abstract

Logging activities significantly impact climate change by contributing to greenhouse gas emissions. However, scientific data on this subject for African forests is limited. This study assesses carbon emission rates resulting from selective logging in Cameroon and proposes measures to mitigate emissions associated with this activity. The research was conducted in Annual Cutting Area 3-1 of Forest Management Unit 1525, known as the "Municipal Forest of Efoulan and Ebolowa 1st." Field data on damaged and extracted biomass were collected across three 15-ha plots and compiled in Microsoft Excel. GPS-derived spatial data were processed using DNRGPS and visualized with ArcGIS 10.5. Allometric equations were applied to dendrometric measurements to estimate aboveground biomass, which was converted to carbon using a factor of 0.5. Emission factors were calculated per cubic meter of extracted wood, and polynomial regression models were used to extrapolate results to the entire cutting area. Open-ended questionnaires administered to site staff and direct field observations evaluated logging technique compliance. Data analysis revealed a logging intensity of 1.6 stems/ha with an average extracted volume of 16.18 m³/ha. Infrastructure construction was identified as the primary source of carbon emissions at 0.497 t C/m³, followed by residues from extracted wood at 0.412 t C/m³. The overall emission factor was 1.067 t C/m³ logged, totaling approximately 17.072 t C/ha. Evaluation of logging techniques indicated that low-impact logging practices (LIP) were applied only 35% of the time. A work procedure code aligned with the regional LIP code has been proposed to reduce emissions. The findings underscore the urgent need for improved forest management practices that prioritize sustainability and carbon sequestration, with stakeholder engagement enhancing implementation effectiveness.

Published in International Journal of Natural Resource Ecology and Management (Volume 11, Issue 1)
DOI 10.11648/j.ijnrem.20261101.16
Page(s) 56-67
Creative Commons

This is an Open Access article, distributed under the terms of the Creative Commons Attribution 4.0 International License (http://creativecommons.org/licenses/by/4.0/), which permits unrestricted use, distribution and reproduction in any medium or format, provided the original work is properly cited.

Copyright

Copyright © The Author(s), 2026. Published by Science Publishing Group

Keywords

Annual Cutting Area, Cameroon, Logging Damage, Carbon Emissions, Selective Logging, Greenhouse, Logging Intensity

1. Introduction
The Congo Basin covers approximately 530 million hectares, with around 300 million hectares of forest, making it the world's second-largest contiguous tropical rainforest. This region is vital for global carbon storage and climate regulation . Its forests and wetlands, including the Cuvette Centrale peatlands, sequester significant carbon pools and support biodiversity and hydrological services essential for both regional and global climate stability . However, deforestation, degradation, and fragmentation increase carbon emissions and jeopardize ecosystem services and livelihoods .
Industrial selective logging occurs across millions of hectares of concession forest in Central Africa, contributing to degradation. The construction of logging roads facilitates further loss and emissions . Uncontrolled extraction undermines long-term resource availability and local economies while often marginalizing indigenous land-use rights and traditional livelihoods . Fragmentation from logging increases biodiversity loss and carbon emissions in smaller forest fragments .
Even selective logging produces greenhouse gases through fuel use (machinery, transport) and CO2 release from damaged or removed biomass. It also diminishes the carbon uptake of the residual stand by altering its structure, species composition, and microclimate, thereby reducing the forest's carbon sequestration capacity . Studies indicate that Reduced Impact Logging (RIL) can significantly limit immediate carbon and energy-exchange disturbances and accelerate recovery compared to conventional practices, positioning RIL as a viable mitigation strategy that balances economic use with climate goals .
This study assesses carbon emissions from selective logging in FMU 1525 (Cameroon) and aims to answer the following questions: What are the impacts of selective logging on carbon emissions, and how can they be mitigated? We test the hypothesis that implementing RIL reduces emissions while maintaining economic sustainability, with objectives to: (1) quantify damage to the residual stand; (2) measure CO2 emissions from logging operations; and (3) propose procedures to reduce emissions during logging, in alignment with REDD+ and monitoring approaches using optical and SAR data for biomass and road mapping to support mitigation and verification.
This work connects ecological science and operational forestry by translating carbon accounting into practical management strategies. It emphasizes that reducing emissions in African tropical forests necessitates both technical solutions and institutional support to overcome economic barriers to adopting low-impact practices, thereby advancing climate mitigation science and sustainable forest governance in the Congo Basin.
2. Materials and Methods
2.1. Presentation of the Study Area
The study was conducted in the Forest Management Unit (FMU) 1525 within the Annual Cutting Allocation (AAC) 3-1 of the Efoulan and Ebolowa 1st Municipal Forests in the South Region of Cameroon (Figure 1a). The biophysical and socio-economic data were derived from the management plan of this municipal forest developed by eCare (2022). The municipalities of Efoulan (3°00'01"N, 10°55'12"E, area: 811.2 km²) and Ebolowa 1st (2°54'11"N, 11°09'E, area: 510 km²) are part of the Mvila department (Figure 1a). Figure 1b illustrates the administrative location of the Efoulan and Ebolowa 1st municipal forest (FMU 1525).
The municipalities reclassified two plots from national domain to production forests, prompting a public notice. An area of 30,237 hectares was incorporated into the private domain of these municipalities by classification act N°2022/3968/PM, dated June 10, 2022. This area is subdivided into six Forest Exploitation Units (UFE), segmented into five Annual Cutting Allocations (AAC), totaling 30 allocations to be exploited. The forest management plan in Cameroon is organized around several blocks and management units. FMU 1525 consists of two blocks: Block A (11655 hectares) and Block B (18582 hectares) (Figure 1a). Each block is divided into five AAC, resulting in a total of 30 AAC distributed across six UFE with a five-year rotation (Figure 1b). Each AAC is exploited within one year, and the rotation of cuts allows for a return to the same AAC after 30 years, in accordance with necessary regeneration in tropical forests.
The responsibility for executing the plan lies with the municipality, which owns the forest domain, and the concessionaire, who must adhere to sustainable management rules under the supervision of the Ministry of Forests and Wildlife (MINFOF). A monitoring committee, which may include local representatives, can also be involved. Timber sales are generally conducted standing, through auctions or private agreements, to licensed logging operators, or after felling if the municipality manages the logging directly. Revenues are allocated as follows: 40% to the state, 40% to municipalities for local development, 10% to neighboring communities, and 10% to the Forest Development Fund for forest rehabilitation. To ensure sustainability, operators must submit management plans demonstrating that the cutting is sustainable, with harvest volumes limited to a specified amount per hectare. The SYDEX system ensures the traceability of logs, marking them to prevent illegal trafficking.
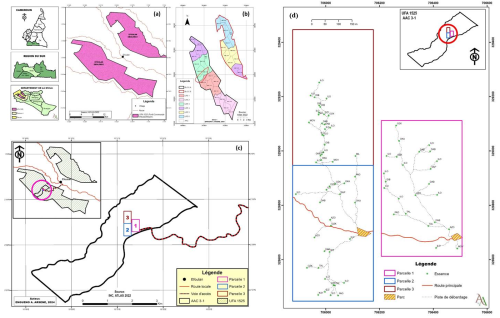
Figure 1. Administrative location of FMU 1525 (a), geographic distribution of AAC within FMU 1525 (b), and location of sampled plots in AAC 3-1 (c-d).
2.2. Methodology
2.2.1. Data Collection
The preparatory phase of documentary analysis (secondary data) was followed by the collection of field data (primary data), and then by the processing and analysis of the data. In this study, the secondary data were obtained from the management documents of FMU 1525 provided by the company Jerun and Cie and from internet research.
2.2.2. Sampling Plan
The AAC 3-1 of FMU 1525 has an area of 1005 ha. The study was conducted in 3 rectangular plots of 15 ha (300 m x 500 m) (Figure 1c-d), for a sampling rate of 4.47%.
(1)
Where: Ts is the sampling rate (expressed as a percentage), Nh is the number of hectares per plot (15 ha), Np is the number of plots (3 plots) and N is the total area of the AAC 3-1 (1005 ha). Due to the late start of the operating activities, the plots were selected from the pockets currently being exploited.
2.2.3. Evaluation of Damage from Selective Logging on the Residual Population in AAC 3-1
First, the intensity of logging was assessed. The logged stems in each plot were identified and cubed according to the standards in force for logging in Cameroon.
Unlike the TIAMA cubing rate, which is generally used to estimate the volume of standing trees but has limited accuracy, the volumes were measured directly on the felled logs (diameter and length per section) and on the marketable branches, in accordance with standard post-felling practices. The logging operations that impacted the population were monitored, and the following procedure was adopted to determine the number of damaged trees per hectare in each plot:
(i) During felling operations, the diameter at breast height (DBH) of trees with at least 10 cm in diameter that were damaged was measured in five felling gaps, and the DBH of the felled tree was recorded. (ii) For park openings, an area equivalent to that of the park was marked out with a marking roller, and an inventory of all trees with at least 10 cm DBH was conducted. (iii) The width of roads in Cameroon generally ranges from 6 to 8 m, in accordance with national standards. To assess the damage caused by the construction of these roads, an inventory was conducted in three plots of 10 m x 10 m, totaling 100 square meters per plot. These plots were randomly positioned along the road alignment to ensure optimal representativity of the observations. The damage was assessed by inventorying trees with at least 10 cm DBH in these three randomly chosen areas along the project axis. (iv) To estimate the impacts of these skids, an inventory was conducted on five randomly selected logging tracks. The logging tracks typically have a width of 4 to 5 meters, depending on the size of the equipment used. The damage caused by logging was assessed over a length of 10 meters along the track, just after the passage of the bulldozer.
The area of roads and logging tracks was calculated using the following formula:
(2)
Where S represents the surface area of the infrastructure (m²), Lmoy the length obtained using GPS (m), and lmoy the width obtained by averaging the measured widths (m).
2.2.4. Assessment of the Amount of Carbon Emitted by Harvesting Operations in AAC 3-1
The methodology for estimating carbon emissions from selective logging is that of Pearson , based on the level 1 hypothesis of the Intergovernmental Panel on Climate Change, which postulates that all extracted carbon is emitted during the event. Following this methodology, emissions were assessed by taking into account the losses of live biomass due to felled trees, damage to neighboring trees, and associated infrastructure. Emissions from fuel consumption and the storage of woody products, deemed insignificant, were not considered, nor were those from underground carbon. The emission factors (EF) related to selective logging were estimated as follows:
(3)
Where EBE = emissions due to extracted wood (t C/m³ extracted), FDA = damage factor of logging: carbon from dead biomass left in clearings following tree felling and accidental damage (t C/m³ extracted), FI = factor of forestry operation infrastructures: carbon from dead biomass related to the construction of roads, logging tracks, and yards (t C/m³ extracted).
Aerial biomass was assessed using allometric equations developed by Fayolle, Rondeux as they were established based on a large number of trees.
(4)
(5)
Where AGB represents aboveground biomass, D the DBH, and specific density. Eq. (4) was used to estimate the biomass of the damaged stand and Eq. (5) the biomass of the extracted wood. The biomass estimates were then converted to carbon using a conversion factor of 1 unit of biomass = 0.5 units of carbon .
(i). Emissions from extracted wood (EEW)
This parameter represents the emissions due to wood residues left during logging (crown and stump) and the logs abandoned after bucking.
For logging: For logging, dendrometric parameters (DBH before logging, length of the log, and diameters at the ends - large end and small end - after logging) were measured on five randomly selected trees in each plot. These measurements were taken using a measuring tape and recorded in the data collection sheet. Equation (6) was then used to assess the remaining biomass at logging sites (RBLS).
(6)
(7)
(8)
Where Bextrait: Extracted biomass (amount of biomass removed from the site), Vextrait: Volume of wood extracted (volume of wood harvested during logging), Di: Wood density (specific density of wood for the species or type of vegetation concerned). Mve: Equivalent bulk density (conversion factor to estimate biomass from volume). n= number of sampled trees, Vte= volume of trunk extracted. π: Mathematical constant approximately equal to 3.14159. Dg: Diameter at the base of the trunk (in meters, m). Dp: Diameter at the tip of the trunk (in meters, m). L: Length of the trunk (in meters, m).
For the processing (sectioning in the park): The five (05) selected trees were monitored in the park using their DF10 numbers, and the logs of each tree were measured with a tape measure and a calculator. This allowed for the assessment of the volume of the residues and therefore the biomass remaining in the BRP park.
(9)
(10)
= wood density of the relevant fuel, = wood density of the relevant fuel.
The emissions due to the extracted wood were determined by equation (11):
(11)
(ii). Damage Factor Related to Felling (FDA)
The assessment was made on five (05) randomly selected trees in each plot: 1° Before felling: the DBH of the tree to be felled was measured using a tape measure. 2° After felling: the damaged trees were identified, their diameters measured, and their biomasses calculated. Equation (13) was used to evaluate the biomass accidentally damaged during the fall of the tree (Baccident).
(12)
Where: represents the biomass accidentally damaged during the tree fall; represents the biomass of the trees identified as damaged.
The Damage Factor related to logging (DFL) was assessed based on equation (14).
(13)
(iii). Factor of Logging Infrastructure
Road Construction: 1° To determine the biomass lost during the construction of a road noted BRT; three (03) areas (SRi) of 10m x 10m sections along the "road project" axis were randomly selected in which all trees with at least 10 cm in DBH were inventoried. Excluding trees smaller than 10 cm DBH may indeed underestimate the lost biomass, as young trees and regeneration also contribute to forest biomass; 2° the average width of the road was calculated from three measurements taken at randomly selected sections along the route. For each section, the width was measured perpendicularly to the road axis using a tape measure, ensuring that the entire right-of-way (roadway + shoulders, if applicable) was included. The obtained values were then averaged to provide a representative estimate of the total width; 3° the length of the road was determined after its construction using a GPS.
Park Opening: Initially, the area of the park was estimated using the GPS "area calculator" (accuracy of 5 m). Although this method is less precise than a measuring tape, it was preferred for practical reasons, including speed of execution and coverage of large rugged or vegetated areas, where using a tape would have proven complex. Then, an area equivalent to that of the park was marked on the ground using a marking roller, applying the dimensions obtained by the GPS (accuracy of 5 m) and verified by spot measurements with a tape measure (the said area was near the park), and a complete inventory of trees (DBH ≥ 10 cm) was carried out, including an estimate of young stems (<10 cm) through representative sampling. The recorded species were systematically noted to identify potential for natural regeneration and subjects of future ecological value. This allowed for the assessment of the biomass destroyed for the construction of the park noted BP.
Logging: The length of the logging tracks was determined using a GPS. On five (05) randomly selected logging tracks, damaged trees were inventoried over a length of 10m along the track, just after the first pass of the bulldozer. The results allowed for the determination of the biomass destroyed by logging noted BD.
With this collected data, the factor of logging infrastructure can be calculated using equation (15):
(14)
(damaged biomass for road construction); (damaged biomass for park construction); (damaged biomass for the construction of logging roads); (Volume extracted from the plots); 0.5: Weighting factor (this coefficient is applied to adjust the overall impact of the infrastructures).
2.2.5. Development of an Operating Procedure to Reduce Carbon Emissions
A survey on the management of integrated forest exploitation measures (EFI) was conducted among the main site managers. They were the resource persons from whom it was possible to obtain the maximum information on a given activity through a guide with open-ended questions. Observations were also made during the execution of the exploitation operations in order to compare them against the prescriptions of the regional EFI code in order to evaluate the discrepancies.
2.3. Data Analysis
After collection, the data were pre-processed to ensure their quality, which included cleaning (correcting errors, handling missing values, removing duplicates) and coding open responses into thematic categories. Then, the collection sheets were compiled using Ms Excel. The GPS data were extracted using DNRGPS and visualized with ArcGis 10.5 software. Allometric equations Eq. (3) were applied to the sampled trees to calculate EF based on the volumes harvested in each sampled area. Finally, extrapolations on the extent of the area were made using polynomial regression models in Ms Excel.
2.4. Data Access
The raw data and metadata associated with this study are available upon request. They include biomass measurements, emission calculations, and maps of sampled plots. Access conditions are open under CC-BY 4.0 license, allowing for reuse for academic purposes with citation of the source.
3. Results
3.1. Damage from Exploitation on the Residual Stand
3.1.1. Intensity of Exploitation
The analysis of the data allowed for the characterization of the floristic composition of the studied plots (Figure 2a). The stand is dominated by Ilomba (Pycnanthus angolensis), which represents 23% of the inventoried individuals, followed by Ozambili (Antrocaryon klaineanum), 15%, and Dabema (Piptadeniastrum africanum), 12%. Other species, such as Bilinga, Movingui, Sapelli (Entandrophragma cylindricum), and Tali (Erythrophleum suaveolens), have relative abundances of less than 10% (Figure 2a). Among these species, Ilomba is the most exploited (41% of the harvested stems), although its natural regeneration is limited in the understory. This species, primarily present in the dominant layer, could see its population compromised in the medium term without appropriate management measures. Other targeted species include Ozambili (12% of the harvests) and Dabema (11%). In AAC 3-1, the average harvest rate is 1.6 stems/ha, or 16.18 m³/ha (Table 1 (a)). This exploitation pressure, coupled with the low regeneration of certain key species, underscores the need to: monitor post-exploitation dynamics, particularly for Ilomba; establish areas excluded from cutting to promote recruitment and diversify exploited species; reduce dependence on vulnerable species.
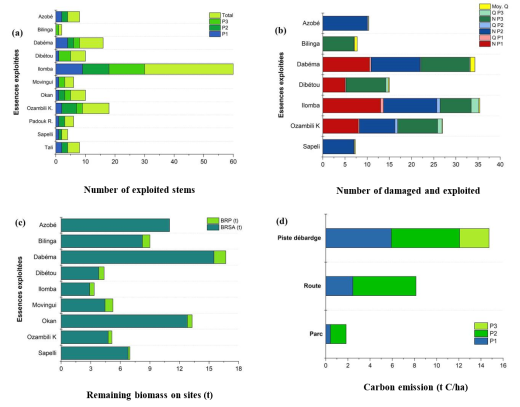
Figure 2. Exploited species and the intensity of exploitation in the AAC are as follows: (a) damage from logging to the residual stand, (b) biomass remaining at the logging site and in the park, (c) and carbon emissions resulting from the construction of forest infrastructure. Here, N represents the number of damaged trees from logging, and Q denotes the ratio of the number of trees logged to the number of damaged trees.
3.1.2. Damage Caused by Felling and Park Opening
The exploited species exhibit varying degrees of felling damage on the residual stand, with Ilomba in the lead, followed by Dabema (Figure 2b). Furthermore, the felling of one tree, across all species, has resulted in an average destruction of about 9 surrounding trees. Table 1 (a) shows that on average, a park covers 782 m², and its opening leads to the disappearance of 69 ± 22 trees, across all diameter classes. The felling of one tree in AAC 3-1 causes the average destruction of about 9 surrounding trees (Figure 2b).
Table 1. Damage caused by the opening of parks (a), road construction (b), and damage caused by logging (c).

Plot

Exploitation Intensity (stems/ha)

Park Area (m²)

% Occupied

N° of Damaged Trees (/ha)

(a) Damage caused by the opening of parks

P1

1.60

15.70

639.4

0.4

P2

1.66

17.44

925.0

0.6

1.66

15.38

0

0

Average

1.64 ± 0.03

16.18 ± 1.10

782.2

0.5

(b) Damage caused by road construction

P1

18.87

10.27

2906.49

2

7.0

P2

21.69

11.07

3601.09

2

7.6

P3

0

0

0

0

0

Average

20.28

10.67 ± 0.57

/

2

7.3

(c) Damage caused by skidding (log extraction)

P1

100.8

5.0

7561.79

5

11.0

P2

112.5

4.4

7426.99

5

11.9

P3

48.5

5.98

4350.68

3

7.9

Average

87.3 ± 34.1

5.13 ± 0.79

/

4 ± 1

10.3 ± 2.09

3.1.3. Damage Caused by Road Construction and Logging
The analysis of the impact of road opening reveals that the road network occupies about 2% of the forest area, with an average width of 10.67 m (Table 1 (b)). Logging trails, on the other hand, occupy an average of 4% of the total area, causing damage to 10.3 trees per hectare (Table 1 (c)). Plot P3 shows no damaged trees, which could indicate an underestimation of the impacts in this area. However, this absence of damage can be explained by several factors. It is possible that the plot is located at a certain distance from areas of intensive extraction, thereby limiting exposure to disturbances. Additionally, the topography of the terrain may be less favorable for the passage of machinery, reducing the risk of degradation. Finally, less dense exploitation in this sector may also contribute to the preservation of the integrity of the existing trees.
3.2. Carbon Emissions from Forestry Exploitation
3.2.1. Emissions from Extracted Wood (EBE) and Felling Damage (FDA)
The analysis reveals that the remaining biomass on the felling site (BRSA) is consistently greater than that left in the log yard (BRP). The species with the highest amounts of BRSA are Dabema, Okan (Cylicodiscus gabunensis), and Azobe (Lophira alata). Regarding BRP, Dabema, Bilinga (Nauclea diderrichii), and Movingui (Distemonanthus benthamianus) generate the largest quantities. The collateral damage from felling shows notable spatial variability, ranging from 57.85 t/ha in plot P1 to 86.9 t/ha in P3. Although these values may appear low in relative terms, they nevertheless represent a significant disturbance to the forest ecosystem.
Regarding carbon emissions, a revised approach has been adopted to better reflect ecological reality. Rather than considering all dead wood as an emission, we now distinguish between: (1) carbon exported in the form of commercial logs (not counted as emissions) and (2) carbon left on site (considered an emission although part will be recycled by the ecosystem). The average emissions thus amount to 6.59 t C/ha for extracted wood (or 0.412 t C/m³) and 2.53 t C/ha for felling damage (or 0.158 t C/m³), for an average harvest of 16 m³/ha. Particular attention has been paid to the density of wood used in the calculations. The average value of 0.82 may overestimate the actual density of certain species like Ilomba.
3.2.2. Emissions from Forestry Exploitation Infrastructures (FI)
Carbon emissions related to the construction of forestry infrastructures vary according to the type of infrastructure and production levels. On average, logging trails generate the highest emissions, at 6.04 t C/ha, followed by roads at 4.07 t C/ha (Figure 2d). In contrast, parks emit only 0.92 t C/ha. Plot P2 has the highest emissions from the construction of forestry infrastructures (0.761 t C/m³) and P3 the lowest (0.172 t C/m³) (Table 2).
Table 2. Emissions due to wood extracted from AAC 3-1 (a), biomass damaged as a result of logging (b), emissions due to the construction of forestry infrastructure (c), and implementation of EFI measures by AAC 3-1 personnel (d).

Parameters

P1

P2

P3

Average

(a) Emissions from wood extracted from AAC 3-1

BRSA (tons)

156.907

168.800

240.751

188.819 ± 45.36

BRP (tons)

7.957

10.763

11.154

9.958 ± 1.74

Total residue biomass (tons)

164.864

179.563

251.905

198.777 ± 46.6

EBE (tons C/m³)

0.350

0.343

0.545

0.412 ± 0.11

(b) Biomass damaged due to felling

Plot

P1

P2

P3

Average

Collateral damage biomass (tons)

57.850

85.514

86.931

76.765 ± 16.39

FDA (tons C/m³)

0.122

0.163

0.188

0.158 ± 0.03

(c) Emissions due to the construction of forest infrastructures

Plot

P1

P2

P3

Average

Skidding trail biomass (tons)

177.302

184.952

79.717

147.324 ± 58.67

Road biomass (tons)

173.666

170.676

/

122.171

Park biomass (tons)

12.719

42.523

/

27.621

FI (tons C/m³)

0.559

0.761

0.172

0.497 ± 0.29

3.2.3. Total C Emissions in AAC 3-1 (FE)
The emission factor related to selective exploitation in AAC 3-1 averages 1.067 ± 0.184 t C/m³. For a harvest rate of 16 m³/ha, this amounts to 17.072 t C/ha, or annual emissions of 17157.36 t C for the 1005 ha exploited in one year.
3.3. Evaluation of Exploitation Practices in AAC 3-1
A total of 60% of the site managers surveyed revealed that they are aware of EFI measures but do not implement them (Table 3). The reasons cited include an increase in the duration of felling operations, which leads to a high consumption of fuel, resulting in additional financial burdens for the company, particularly for road and bridge construction. As a result, the comparison of exploitation practices in AAC 3-1 with prescribed measures to minimize the impact of forestry exploitation (Table 3) shows that only 35% of the measures from the Regional Code of Low Impact Forestry Exploitation (EFI) are adhered to (Figure 3). While some activities, such as creating parks, felling, bucking, and logging, are compliant, others, such as road network layout and road construction, show a high level of non-compliance. This situation indicates variability in the compliance of forestry activities, highlighting a need for improvement and training to ensure better adherence to EFI prescriptions.
Table 3. Comparison of operating methods in AAC 3-1 compared to EFI methods.

Activity

Evaluated Parameter

Observation

EFI Prescription

Pre-exploitation Planning

Road network layout

Done during exploitation

Should be done one year before exploitation

Skidding trail network layout

Done during exploitation

Should be done a few weeks or months before exploitation

Loading park

Done during exploitation

Should be done a few weeks or months before exploitation

Implementation

Road construction

Insufficient sunlight width

Limit sunlight width as much as possible

Not considered

Favor road placement on ridges in easy or moderately rugged terrain

Skidding

Operator creates own routes

Operator with tractor should stick to marked trails and avoid opening new ones

Too many turns

Trails should be as straight as possible; avoid sharp turns to prevent damage to trees along the trail

Tractor leaves trail to get closer to the log

Tractor is not normally allowed to leave the trail; it should extract the stump

Park creation

Average park area is about 700 m²

Average loading park area should range between 600 and 1200 m²

Not enough parks opened

Minimize the number of parks opened

Park is a meeting point for multiple parks

Park should be located at the convergence point of several skidding trails

Felling

Felling technique

Conventional felling

Use controlled felling

Topping and pruning

Topping and pruning during skidding

Perform topping and pruning at the same time as felling

Topping depends on the diameter of the end

Top as much as possible beyond the first large branch

Total abandonment of buttresses

Recover the base of the trunk with buttresses by cutting them longitudinally to obtain a cylindrical shape

Processing

Bucking

Bucking at the level of buttresses

Do not cut the base of the trunk with buttresses; cut them longitudinally to obtain a cylindrical log

Logs only from the stem

Form logs not only from the stem but also from large branches of the crown to recover maximum volume and timber value

Waste Management

None

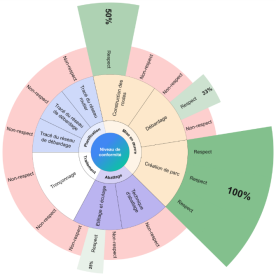
Figure 3. Level of compliance of operating activities in the AAC 3-1 with EFI requirements.
4. Discussion
4.1. Environmental Impact of Logging
The observed low extraction intensity in AAC 3-1 (1.6stems·ha-1) aligns with strategies aimed at limiting overharvesting and reducing long term ecosystem harm . The reported species composition and densities (Ilomba 5.58, Dabema 1.54, Onzabili 0.67 stems·ha⁻¹) as well as planned extractions for 2024 (Ilomba 528; Onzabili 433; Dabema 395) indicate that these species are locally abundant and targeted for harvest. However, high demand coupled with elevated density may jeopardize regeneration, particularly when damage occurs to recruits and neighboring trees . Measured collateral damage (an average of 9 neighboring trees felled per harvested tree; clearing of 782.2 m² leading to a loss of approximately 69 trees) demonstrates the well-documented effects of felling, skid trails, and clearings on residual stand structure, soil disturbance, and community imbalance . Road and track footprints (approximately 2% of the area; widths of 10.1–11.2 m; tracks covering 3–5% of the area) create fragmentation and edge effects that alter microclimates and species interactions, echoing The comparatively lower tree damage per log observed in this study (10.3 vs. 15.6 trees) may reflect better site practices or local conditions.
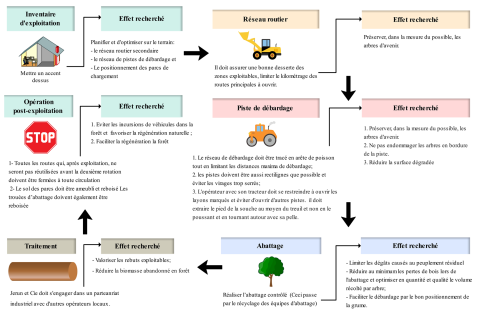
Figure 4. Proposal for a strategy to limit carbon emissions.
This finding emphasizes the need for contextualized impact assessments and the adoption of EFI/RIL prescriptions. Such measures are essential to balance economic use with critical ecosystem services, including carbon sequestration and soil protection .
4.2. Carbon Emissions from Logging
Species-specific residual biomass variation (e.g., Dabema, Okan, Azobe maxima) corresponds with differences in wood density and physical traits that influence biomass and emission estimates . Our emission factor (0.412 t C·m⁻³) and infrastructure factor (0.497 t C·m⁻³ at 16 m³·ha⁻¹) exceed some international benchmarks, likely due to higher extraction intensity and larger infrastructure areas. This site-specific variation aligns with literature highlighting local drivers of logging emissions and the significant contributions of roads and tracks to carbon loss and fossil fuel use during construction and transport . The finding that clearings produce lower emissions per area than roads and tracks is due to their smaller footprint, while roads and tracks generate higher emissions through deforestation, soil disturbance, and fuel combustion linking infrastructure development with emissions trade-offs reported for Africa . The AAC's annual logging emissions (17,157.36 t C) illustrate substantial local carbon costs and underscore calls for operational shifts toward RIL/EFI to reduce emissions while maintaining yields .
4.3. Improving Logging Techniques to Reduce Carbon Emissions
The 35% compliance with regional EFI prescriptions highlights gaps between knowledge and field practice, typically driven by economic and capacity constraints. These barriers to sustainable forest management (SFM) adoption are well documented in Central Africa and hinder REDD+ effectiveness without tenure, financial, and technical support . Implementing EFI/RIL measures (pre-harvest planning, directional felling, skid-trail design, reduced opening sizes, workforce training) can minimize collateral damage and accelerate carbon recovery even if short-term machinery use increases fuel consumption resulting in net emission reductions and potential market premiums through certification (FSC/PAFC) that enhance economic viability . These trade-offs and the need for integrated policies and financing to facilitate practice change are supported by regional analyses of SFM, REDD+ feasibility, and monitoring methods (optical/SAR) for verifying biomass and road impacts .
5. Conclusion
This study aimed to contribute to reducing carbon emissions resulting from the exploitation of tropical forests. It was highlighted that in AAC 3-1 of FMU 1525, the intensity of exploitation is 1.6 stems per hectare for an average volume of 16.18 m³/ha. For this extraction, logging activities caused several damages to the residual stand. The felling of one tree notably caused the loss of approximately 9 surrounding trees, and the opening of a clearing averaged 69 trees. The opening of a secondary road caused the loss of 7.3 stems/ha and logging that of 10.3 stems/ha. Logging was therefore the most degrading activity. These parameters allowed for the determination of the emission factor, which was overall 1.067 t C/m³ or approximately 17.072 t C/ha, resulting in an annual carbon emission of 17,157.36 t C for the 1005 ha occupied by AAC 3-1. Given the low application of Low Impact Forestry (EFI) measures (35% compliance), a corrective procedure has been proposed, including: pre-exploitation planning (rigorous inventory, optimized routing of roads and tracks); controlled felling techniques and targeted logging to limit collateral damage, and systematic closure of roads post-exploitation and regeneration of disturbed areas. This approach, inspired by the EFI code, could reduce emissions by about 10% if fully implemented. Its adoption within FMU 1525 is essential to reconcile sustainable exploitation and mitigation of climate impacts while preserving the ecosystem services of tropical forests. Enhanced training and rigorous monitoring of practices on the ground will be necessary to ensure its long-term effectiveness.
Abbreviations

AGB

Aboveground Biomass

D

Diameter

DFL

Damage Factor Related to Logging

DBH

Diameter at Breast Height

EBE

Emissions Due to Extracted Wood

EEW

Emissions From Extracted Wood

EF

Emission Factors

FDA

Damage Factor of Logging

FI

Factor of Logging Infrastructure

RBLS

Remaining Biomass at Logging Sites

Acknowledgments
The study was conducted in the Efoulan and Ebolowa 1st Municipal Forest, operated under a logging agreement with Jerun and Company Sarl. The authors thank Jerun and Company Sarl for the logistic support in data collection.
Author Contributions
Rodine Tchiofo Lontsi: Conceptualization, Writing – original draft, Writing – review & editing
Arsene Engueno Abena: Conceptualization, Writing – original draft
Emilienne Laure Ngahane: Conceptualization, Writing – original draft
Charles Degaule Sap Sap: Conceptualization, Writing – original draft
Mbezele Junior Yannick Ngaba: Conceptualization, Writing – original draft, Data curation, Formal Analysis, Writing – review & editing
Funding
This research was primarily funded by internal funds from the Higher Institute of Agriculture, Wood, Water, and Environment (ISABEE) and by logistic support from Jerun and Company Sarl. No specific external funding was received for this project.
Conflicts of Interest
This study adhered to the ethical and deontological rules in force in Cameroon, in accordance with the recommendations of Wood and Forests of the Tropics. Data were collected with the consent of local stakeholders, including Jerun and Company Sarl, and anonymized to preserve confidentiality. No conflict of interest was identified.
References
[1] Justice, C., et al. “Central African Forests, Carbon and Climate Change”. Climate Research, 2001. 17: p. 229-246.
[2] Keddy, P. A., et al. “Wet and Wonderful: The World's Largest Wetlands Are Conservation Priorities”. Bioscience, 2009. 59(1): p. 39-51.
[3] Burgin, L., et al. “Insights on Climate Risks to the Central African Forest Ecosystems: An Interdisciplinary Review”. Climate Resilience and Sustainability, 2025. 4(1).
[4] Sonwa, D., et al. “Potential Synergies of the Main Current Forestry Efforts and Climate Change Mitigation in Central Africa”. Sustainability Science, 2010. 6(1): p. 59-67.
[5] Hansen, M. C., et al. “The Fate of Tropical Forest Fragments”. Science Advances, 2020. 6(11).
[6] Malhi, Y., et al. “Climate Change and Ecosystems: Threats, Opportunities and Solutions”. Philosophical Transactions of the Royal Society B Biological Sciences, 2020. 375(1794): p. 20190104.
[7] Slagter, B., K. A. Fesenmyer, and J. Reiche. “Rapid Monitoring of Congo Basin Logging Roads With Sentinel-1 and Sentinel-2 Data”. 2023.
[8] Bellassen, V. and V. Gitz. “Reducing Emissions From Deforestation and Degradation in Cameroon — Assessing Costs and Benefits”. Ecological Economics, 2008. 68(1-2): p. 336-344.
[9] Richard, S. “Obstacles to a Conceptual Framework for Sustainable Forest Management Under REDD in Central Africa: A Two-Country Analysis”. 2012.
[10] Kumar, A., et al. “Facile hetero-assembly of superparamagnetic Fe3O4/BiVO4 stacked on biochar for solar photo-degradation of methyl paraben and pesticide removal from soil”. Journal of Photochemistry and Photobiology a-Chemistry, 2017. 337: p. 118-131.
[11] Miller, S. D., et al. “Reduced Impact Logging Minimally Alters Tropical Rainforest Carbon and Energy Exchange”. Proceedings of the National Academy of Sciences, 2011. 108(48): p. 19431-19435.
[12] Pearson, T. R., Sandra Brown, and Felipe M. Casarim. “Carbon emissions from tropical forest degradation caused by logging”. Environmental Research Letters, 2014. 9.3(034017).
[13] Fayolle, A., et al. “Reviser Les Tarifs De Cubage Pour Mieux Gerer Les Forêts Du Cameroun”. Bois & Forets Des Tropiques, 2013. 317(317): p. 35.
[14] Hwang, K., et al. “Amount and Location of Damage to Residual Trees From Cut-to-Length Thinning Operations in a Young Redwood Forest in Northern California”. Forests, 2018. 9(6): p. 352.
[15] Biwôle, A. B., et al. “Dynamique Des Populations D'azobe, Lophira Alata Banks Ex C. F. Gaertn., Et Implications Pour Sa Gestion Durable Au Cameroun”. Bois & Forets Des Tropiques, 2019. 342.
[16] Lewis, R. “Mt Apo and Other National Parks in the Philippines”. Oryx, 1988. 22(2): p. 100-109.
[17] Iddris, N. A. “Trace Gas Fluxes From Soils and Tree Stems of Rainforests and Cacao Agroforests in the Congo Basin, Cameroon”.
[18] Alemagi, D., et al. “Analyzing the Contribution of Cameroon’s Council Forests to Climate Change Mitigation and Socioeconomic Development”. 2016.
[19] Toan, T. L., et al. “Comparison of Optical and SAR Data for Forest Cover Mapping: REDD&#x002B; May Be Helped by SAR Data”. 2014: p. 2305-2308.
Cite This Article
  • APA Style

    Lontsi, R. T., Abena, A. E., Ngahane, E. L., Sap, C. D. S., Ngaba, M. J. Y. (2026). Carbon Emissions from Selective Logging: Case of FMU 1525 (Southern Cameroon). International Journal of Natural Resource Ecology and Management, 11(1), 56-67. https://doi.org/10.11648/j.ijnrem.20261101.16

    Copy | Download

    ACS Style

    Lontsi, R. T.; Abena, A. E.; Ngahane, E. L.; Sap, C. D. S.; Ngaba, M. J. Y. Carbon Emissions from Selective Logging: Case of FMU 1525 (Southern Cameroon). Int. J. Nat. Resour. Ecol. Manag. 2026, 11(1), 56-67. doi: 10.11648/j.ijnrem.20261101.16

    Copy | Download

    AMA Style

    Lontsi RT, Abena AE, Ngahane EL, Sap CDS, Ngaba MJY. Carbon Emissions from Selective Logging: Case of FMU 1525 (Southern Cameroon). Int J Nat Resour Ecol Manag. 2026;11(1):56-67. doi: 10.11648/j.ijnrem.20261101.16

    Copy | Download

  • @article{10.11648/j.ijnrem.20261101.16,
      author = {Rodine Tchiofo Lontsi and Arsene Engueno Abena and Emilienne Laure Ngahane and Charles Degaule Sap Sap and Mbezele Junior Yannick Ngaba},
      title = {Carbon Emissions from Selective Logging: Case of FMU 1525 (Southern Cameroon)},
      journal = {International Journal of Natural Resource Ecology and Management},
      volume = {11},
      number = {1},
      pages = {56-67},
      doi = {10.11648/j.ijnrem.20261101.16},
      url = {https://doi.org/10.11648/j.ijnrem.20261101.16},
      eprint = {https://article.sciencepublishinggroup.com/pdf/10.11648.j.ijnrem.20261101.16},
      abstract = {Logging activities significantly impact climate change by contributing to greenhouse gas emissions. However, scientific data on this subject for African forests is limited. This study assesses carbon emission rates resulting from selective logging in Cameroon and proposes measures to mitigate emissions associated with this activity. The research was conducted in Annual Cutting Area 3-1 of Forest Management Unit 1525, known as the "Municipal Forest of Efoulan and Ebolowa 1st." Field data on damaged and extracted biomass were collected across three 15-ha plots and compiled in Microsoft Excel. GPS-derived spatial data were processed using DNRGPS and visualized with ArcGIS 10.5. Allometric equations were applied to dendrometric measurements to estimate aboveground biomass, which was converted to carbon using a factor of 0.5. Emission factors were calculated per cubic meter of extracted wood, and polynomial regression models were used to extrapolate results to the entire cutting area. Open-ended questionnaires administered to site staff and direct field observations evaluated logging technique compliance. Data analysis revealed a logging intensity of 1.6 stems/ha with an average extracted volume of 16.18 m³/ha. Infrastructure construction was identified as the primary source of carbon emissions at 0.497 t C/m³, followed by residues from extracted wood at 0.412 t C/m³. The overall emission factor was 1.067 t C/m³ logged, totaling approximately 17.072 t C/ha. Evaluation of logging techniques indicated that low-impact logging practices (LIP) were applied only 35% of the time. A work procedure code aligned with the regional LIP code has been proposed to reduce emissions. The findings underscore the urgent need for improved forest management practices that prioritize sustainability and carbon sequestration, with stakeholder engagement enhancing implementation effectiveness.},
     year = {2026}
    }
    

    Copy | Download

  • TY  - JOUR
    T1  - Carbon Emissions from Selective Logging: Case of FMU 1525 (Southern Cameroon)
    AU  - Rodine Tchiofo Lontsi
    AU  - Arsene Engueno Abena
    AU  - Emilienne Laure Ngahane
    AU  - Charles Degaule Sap Sap
    AU  - Mbezele Junior Yannick Ngaba
    Y1  - 2026/03/04
    PY  - 2026
    N1  - https://doi.org/10.11648/j.ijnrem.20261101.16
    DO  - 10.11648/j.ijnrem.20261101.16
    T2  - International Journal of Natural Resource Ecology and Management
    JF  - International Journal of Natural Resource Ecology and Management
    JO  - International Journal of Natural Resource Ecology and Management
    SP  - 56
    EP  - 67
    PB  - Science Publishing Group
    SN  - 2575-3061
    UR  - https://doi.org/10.11648/j.ijnrem.20261101.16
    AB  - Logging activities significantly impact climate change by contributing to greenhouse gas emissions. However, scientific data on this subject for African forests is limited. This study assesses carbon emission rates resulting from selective logging in Cameroon and proposes measures to mitigate emissions associated with this activity. The research was conducted in Annual Cutting Area 3-1 of Forest Management Unit 1525, known as the "Municipal Forest of Efoulan and Ebolowa 1st." Field data on damaged and extracted biomass were collected across three 15-ha plots and compiled in Microsoft Excel. GPS-derived spatial data were processed using DNRGPS and visualized with ArcGIS 10.5. Allometric equations were applied to dendrometric measurements to estimate aboveground biomass, which was converted to carbon using a factor of 0.5. Emission factors were calculated per cubic meter of extracted wood, and polynomial regression models were used to extrapolate results to the entire cutting area. Open-ended questionnaires administered to site staff and direct field observations evaluated logging technique compliance. Data analysis revealed a logging intensity of 1.6 stems/ha with an average extracted volume of 16.18 m³/ha. Infrastructure construction was identified as the primary source of carbon emissions at 0.497 t C/m³, followed by residues from extracted wood at 0.412 t C/m³. The overall emission factor was 1.067 t C/m³ logged, totaling approximately 17.072 t C/ha. Evaluation of logging techniques indicated that low-impact logging practices (LIP) were applied only 35% of the time. A work procedure code aligned with the regional LIP code has been proposed to reduce emissions. The findings underscore the urgent need for improved forest management practices that prioritize sustainability and carbon sequestration, with stakeholder engagement enhancing implementation effectiveness.
    VL  - 11
    IS  - 1
    ER  - 

    Copy | Download

Author Information
  • Department of Forestry, Wood Science and Technology, Higher Institute of Agriculture, Wood, Water, and Environment (ISABEE), University of Ebolowa, Ebolowa, Cameroon

  • Society Jerun and Company Sarl, Ebolowa, Cameroon

  • Department of Forestry, Wood Science and Technology, Higher Institute of Agriculture, Wood, Water, and Environment (ISABEE), University of Ebolowa, Ebolowa, Cameroon

  • Society Jerun and Company Sarl, Ebolowa, Cameroon

  • Department of Forestry, Wood Science and Technology, Higher Technical Teachers Training College (HTTTC), University of Ebolowa, Ebolowa, Cameroon

  • Abstract
  • Keywords
  • Document Sections

    1. 1. Introduction
    2. 2. Materials and Methods
    3. 3. Results
    4. 4. Discussion
    5. 5. Conclusion
    Show Full Outline
  • Abbreviations
  • Acknowledgments
  • Author Contributions
  • Funding
  • Conflicts of Interest
  • References
  • Cite This Article
  • Author Information